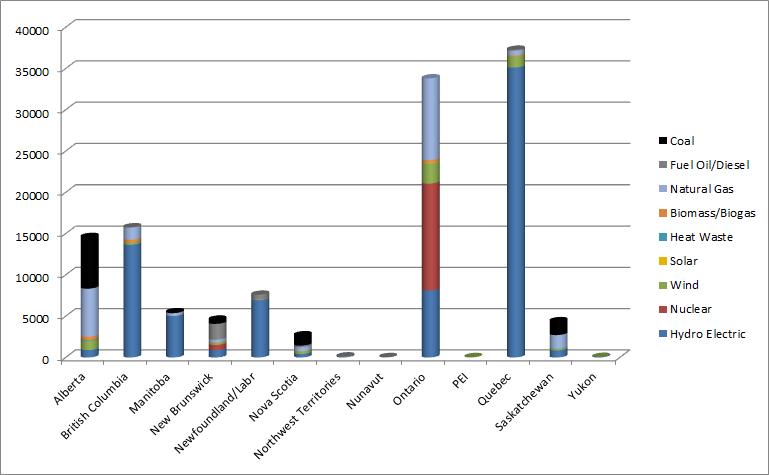
Electricity Sources by Province
The graph below shows the total electricity generation capacity of each province and territory in Canada by energy source. For the most part, when provinces invest in electricity generation capacity they must balance three important factors:
- What options are available? (For example, dammable lakes or rivers, natural gas reserves, etc.)
- What are the lowest cost electricity production methods?
- What are the cleanest sources of energy?
Scroll down to see the actual number of Megawatts generated by each method.

|
|
| Province |
Hydroelectric |
Nuclear |
Biomass/Biogas |
Wind |
Heat Waste |
Solar |
Natural Gas |
Fuel Oil/Diesel |
Coal |
Total |
| Alberta |
900 |
|
417 |
1113 |
86 |
|
5812 |
12 |
6258 |
14598 |
| British Columbia |
13647 |
|
358 |
248 |
12 |
|
1464 |
48 |
|
15777 |
| Manitoba |
5027 |
|
|
|
|
|
347 |
|
111 |
5485 |
| New Brunswick |
889 |
635 |
45 |
249 |
|
|
348 |
1908 |
516 |
4590 |
| Newfoundland Labrador |
6951 |
|
15 |
54 |
|
|
|
590 |
|
7610 |
| Nova Scotia |
420 |
|
|
329 |
|
|
500 |
192 |
1252 |
2693 |
| Northwest Territories |
55 |
|
|
|
|
|
|
73 |
|
128 |
| Nunavut |
|
|
|
|
|
|
|
53 |
|
53 |
| Ontario |
8119 |
12947 |
302 |
2483 |
|
50 |
9920 |
|
|
33821 |
| PEI |
|
|
|
52 |
|
|
|
|
|
52 |
| Quebec |
35125 |
|
114 |
1349 |
|
|
573 |
130 |
|
37291 |
| Saskatchewan |
853 |
|
4 |
199 |
20 |
|
1639 |
|
1682 |
4397 |
| Yukon |
73 |
|
|
1 |
|
|
|
|
|
74 |
|
|

